A time ago I measured what is the minimum government set wage in European Union (EU). It turned out - the most minimum wage is received in Luxembourg while the least in Romania.
In today's article - average salary in EU for the year of 2014.
Update: Average Salary in European Union 2018
Average salary in European Union 2014
| Rank | Country | USD NET | EUR NET | Year |
| 1 | Luxembourg | 3986.25 | 3189 | 2010 |
| 2 | Denmark | 3902.5 | 3122 | 2012 |
| 3 | Sweden | 3362.5 | 2690 | 2014 |
| 4 | United Kingdom | 3246.25 | 2597 | 2013 |
| 5 | Finland | 2912.5 | 2330 | 2014 |
| 6 | Ireland | 2700 | 2160 | 2013 |
| 7 | Netherlands | 2670 | 2136 | 2012 |
| 8 | France | 2660 | 2128 | 2011 |
| 9 | Austria | 2642.5 | 2114 | 2012 |
| 10 | Germany | 2567.5 | 2054 | 2013 |
| 11 | Belgium | 2432.5 | 1946 | 2013 |
| 12 | Italy | 2403.75 | 1923 | 2014 |
| 13 | Cyprus | 2291.25 | 1833 | 2013 |
| 14 | Spain | 2018.75 | 1615 | 2013 |
| 15 | Malta | 1365 | 1092 | 2013 |
| 16 | Slovenia | 1305 | 1044 | 2012 |
| 17 | Portugal | 1231.25 | 985 | 2014 |
| 18 | Estonia | 1051.25 | 841 | 2014 |
| 19 | Greece | 1022.5 | 818 | 2014 |
| 20 | Croatia | 887.5 | 710 | 2013 |
| 21 | Czech Republic | 876.25 | 701 | 2013 |
| 22 | Slovakia | 853.75 | 683 | 2013 |
| 23 | Poland | 847.5 | 678 | 2013 |
| 24 | Latvia | 696.25 | 557 | 2014 |
| 25 | Lithuania | 655 | 524 | 2013 |
| 26 | Hungary | 628.75 | 503 | 2014 |
| 27 | Romania | 497.5 | 398 | 2013 |
| 28 | Bulgaria | 416.25 | 333 | 2013 |
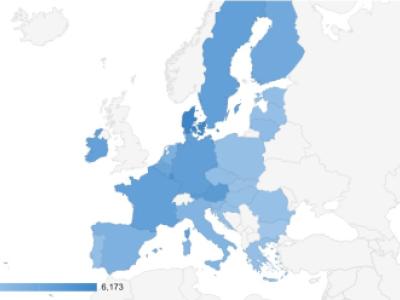
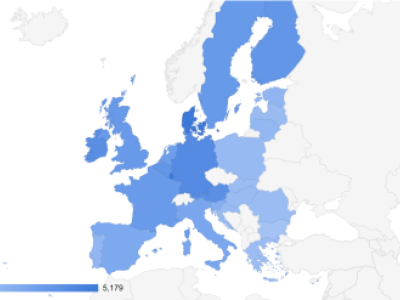
The average salary in European Union
There are two countries you might consider to move if you are looking for higher pay raise - Luxembourg and Denmark, those are only 2 countries where the average salary is higher than EUR 3000 per month (close to $4,000).
By the way - Luxembourg leads the minimum wage table as well

Average Salary in European Union 2014