This is not trading advice. Investments in stocks, funds, bonds, or cryptocurrencies involve risk, and it is possible to lose some or all of the money invested. Do your own due diligence before investing in any asset.
Before this test, I had often traded a 1-minute chart because it appeared to offer more trades and more excitement. Although it sometimes seemed to work, I repeatedly ended up blowing up my account, including through an open overnight trade. My working observation was that the 1-minute chart was too noisy. Moving to five-minute candles was an attempt to reduce some of that noise, not a conclusion already proven by data.
The Strategy Setup
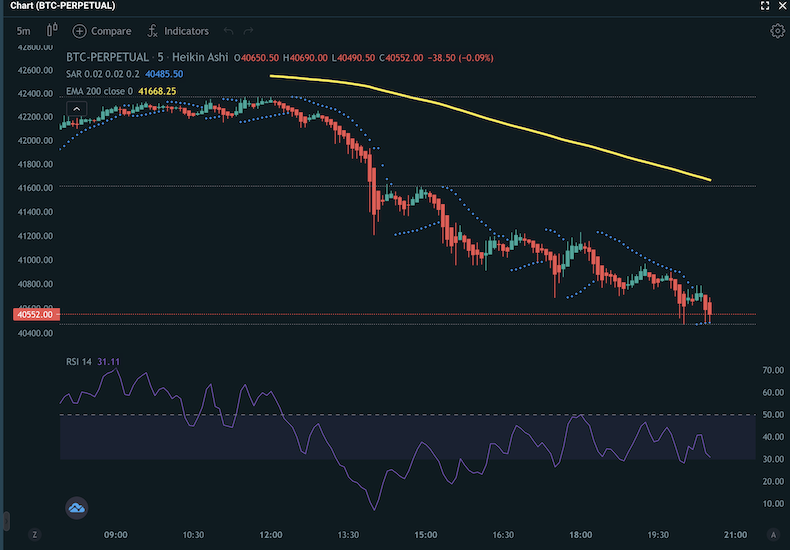
In this historical test, I used a 5-minute Bitcoin chart with Heikin-Ashi candles. The recorded indicators were Parabolic SAR, a 200-period EMA, and RSI. The original article states that Parabolic SAR and EMA were left at their default settings, while RSI was fine-tuned; it does not record the exact RSI setting.
- Timeframe: 5 minutes
- Candles: Heikin-Ashi
- Indicators: Parabolic SAR, EMA 200 and RSI
Why These Indicators Were Combined
The original logic was to use the EMA 200 for directional context, Parabolic SAR for a potential change in direction, and RSI as confirmation. Heikin-Ashi candles were part of the effort to make the five-minute chart feel less noisy than the one-minute chart I had previously been using.
This was a practical chart-reading experiment. The original article did not establish that the indicator combination had an edge across different Bitcoin market conditions.
Entry and Exit Rules
The original article contains the following entry logic:
- Only enter when all three stated conditions are met.
- Use the EMA 200 for direction: above the EMA, enter buy trades only; below the EMA, short Bitcoin.
- After the directional context is set, enter when Parabolic SAR changes direction. The short example was a blue Parabolic SAR dot above the candle.
- For a short, use RSI below 50 as confirmation.
The original article did not document explicit exit rules, stop-loss rules, profit targets, exact RSI parameters, position sizing, or a complete long-trade confirmation rule. Those omissions matter: they mean this record is not detailed enough to reproduce or formally evaluate the system.
Historical Test / Example
The screenshots below were captured on 11 and 12 April 2022. The first shows the chart setup; the second is labelled as a Bitcoin trading journal. In the original article, I wrote that I took five short Bitcoin trades using this approach and that all five were winning trades, among some of my best trades at that time.
That is a first-person observation from a small historical sample, not a measured win rate or proof of profitability. The article does not provide the individual entries, exits, prices, profit and loss, or a defined testing window.

What the Test Showed
For this small set of observations, I found the five-minute chart more manageable than the one-minute chart and recorded five winning short trades. At the time, that made the longer timeframe feel more promising to me.
The result supports only that narrow historical observation. It does not show whether the rules would work over a larger sample, in another market regime, after costs, or with different execution.
What the Test Did Not Prove
- It was not a formal backtest with a documented sample size, date range or trade count beyond the five short trades noted.
- The original record does not include a full trade log, exact entries and exits, profit figures, drawdown or a measured win rate.
- Transaction costs, fees, slippage and funding assumptions were not documented.
- No out-of-sample validation or comparison with other market regimes was included.
- The strategy rules are incomplete, particularly for exits and the exact RSI configuration.
Risks and Practical Limitations
Short timeframes can still produce false signals and choppy conditions. Heikin-Ashi candles are a different representation of price, which can make a chart easier to read while also changing the visual reference for execution. Parabolic SAR and RSI can lag or conflict, and a directional filter does not prevent losing trades. Fees, slippage, leverage, overnight exposure and position sizing can materially change an outcome even when a chart setup appears clear.
The earlier experience described here is also a reminder that frequent trading and open positions can introduce risks that are not solved just by adding indicators.
How This Relates to My Newer Heikin-Ashi Testing
This Bitcoin experiment is separate from my later 1-minute Heikin-Ashi scalping test on Nasdaq futures. Both articles involve Heikin-Ashi candles, but they cover different instruments, timeframes and research questions. The Nasdaq article discusses its own methodology, including leverage, transaction costs, synthetic candle prices and expectancy; it should not be read as validation of this Bitcoin setup.
What I Would Test Next
To evaluate this idea more seriously, I would need a longer and clearly defined sample, fully specified entry and exit rules, transaction-cost and slippage assumptions, several market regimes, and a comparison of raw candles with Heikin-Ashi candles. Those are next testing steps, not tests claimed in this article.
Related Trading Strategies
For the wider collection, see the Trading Strategies hub. My first impressions of a simple BTC trading bot with Gekko and the guide to setting up a Gekko BTC trading bot on a VPS are earlier bot-experiment records. For a more recent systematic-trading design and risk discussion, see my 1 DTE Ethereum options-bot notes.