While working with the TerraM trading bot, I conducted a backtest to quantify the frequency of significant daily drawdowns over the past 365 days (May 4, 2025 – May 3, 2026). Specifically, I analyzed how often the daily price change exceeded -5% or more. The results are notable.
The dataset is based on historical price data sourced from CoinMarketCap, with calculations performed in Google Sheets. Daily performance was measured as the percentage change between the open and close prices.
Out of 365 trading days—reflecting the continuous nature of crypto markets—194 days closed negative, while 171 days were positive. This distribution suggests a moderately bearish environment over the observed period, consistent with broader market conditions.
Distribution of Daily Drawdowns (ETH, 365-Day Backtest)
| Drawdown Threshold | Number of Days | % of Total Days |
|---|---|---|
| > -1% | 132 | 36.2% |
| > -2% | 95 | 26.0% |
| > -3% | 64 | 17.5% |
| > -4% | 41 | 11.2% |
| > -5% | 26 | 7.1% |
| > -6% | 15 | 4.1% |
| > -7% | 11 | 3.0% |
| > -8% | 7 | 1.9% |
| > -9% | 4 | 1.1% |
| > -10% | 3 | 0.8% |
These figures provide a clearer statistical basis for evaluating downside volatility and tail risk in Ethereum over a continuous trading environment.
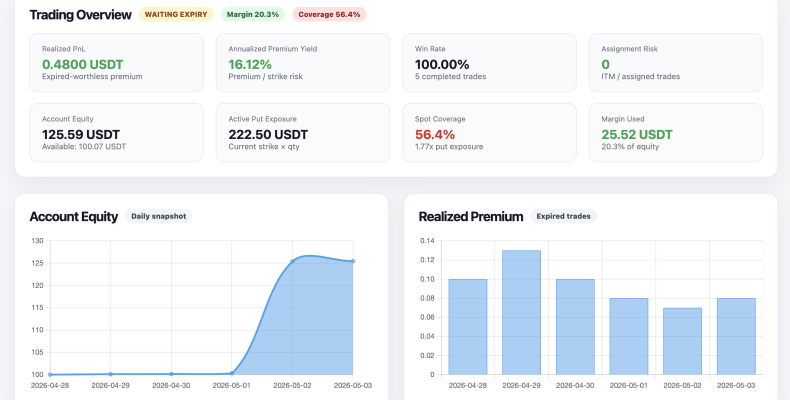
Strategy Context: 1 DTE ETH Options Bot
The TerraM 1 DTE ETH trading bot is designed to systematically scan daily Ethereum price action and initiate high-probability options trades. The strategy focuses on selling options with deltas below -0.10, with typical positioning in the -0.05 to -0.03 range, implying a strong bias toward low-probability tail events.
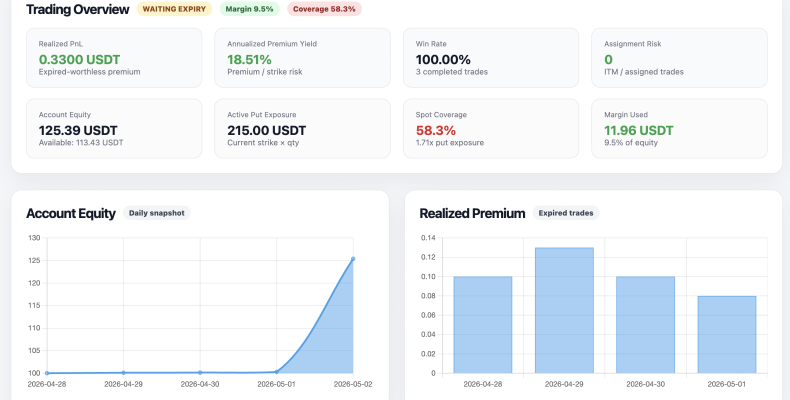
At this stage, the live dataset remains limited. Since deployment, only five trading days of real-time observations are available—insufficient for statistically meaningful conclusions but useful for initial validation and forward tracking. Expanding this dataset over time will be critical to confirm whether realized drawdown frequencies align with the historical backtest and whether the assumed tail risk pricing is adequate.
After evaluating the bot’s strike selection relative to actual market movements, the initial results show a 100% win rate over the first five trading days. This is not statistically meaningful given the extremely small sample size, but it provides a preliminary signal.
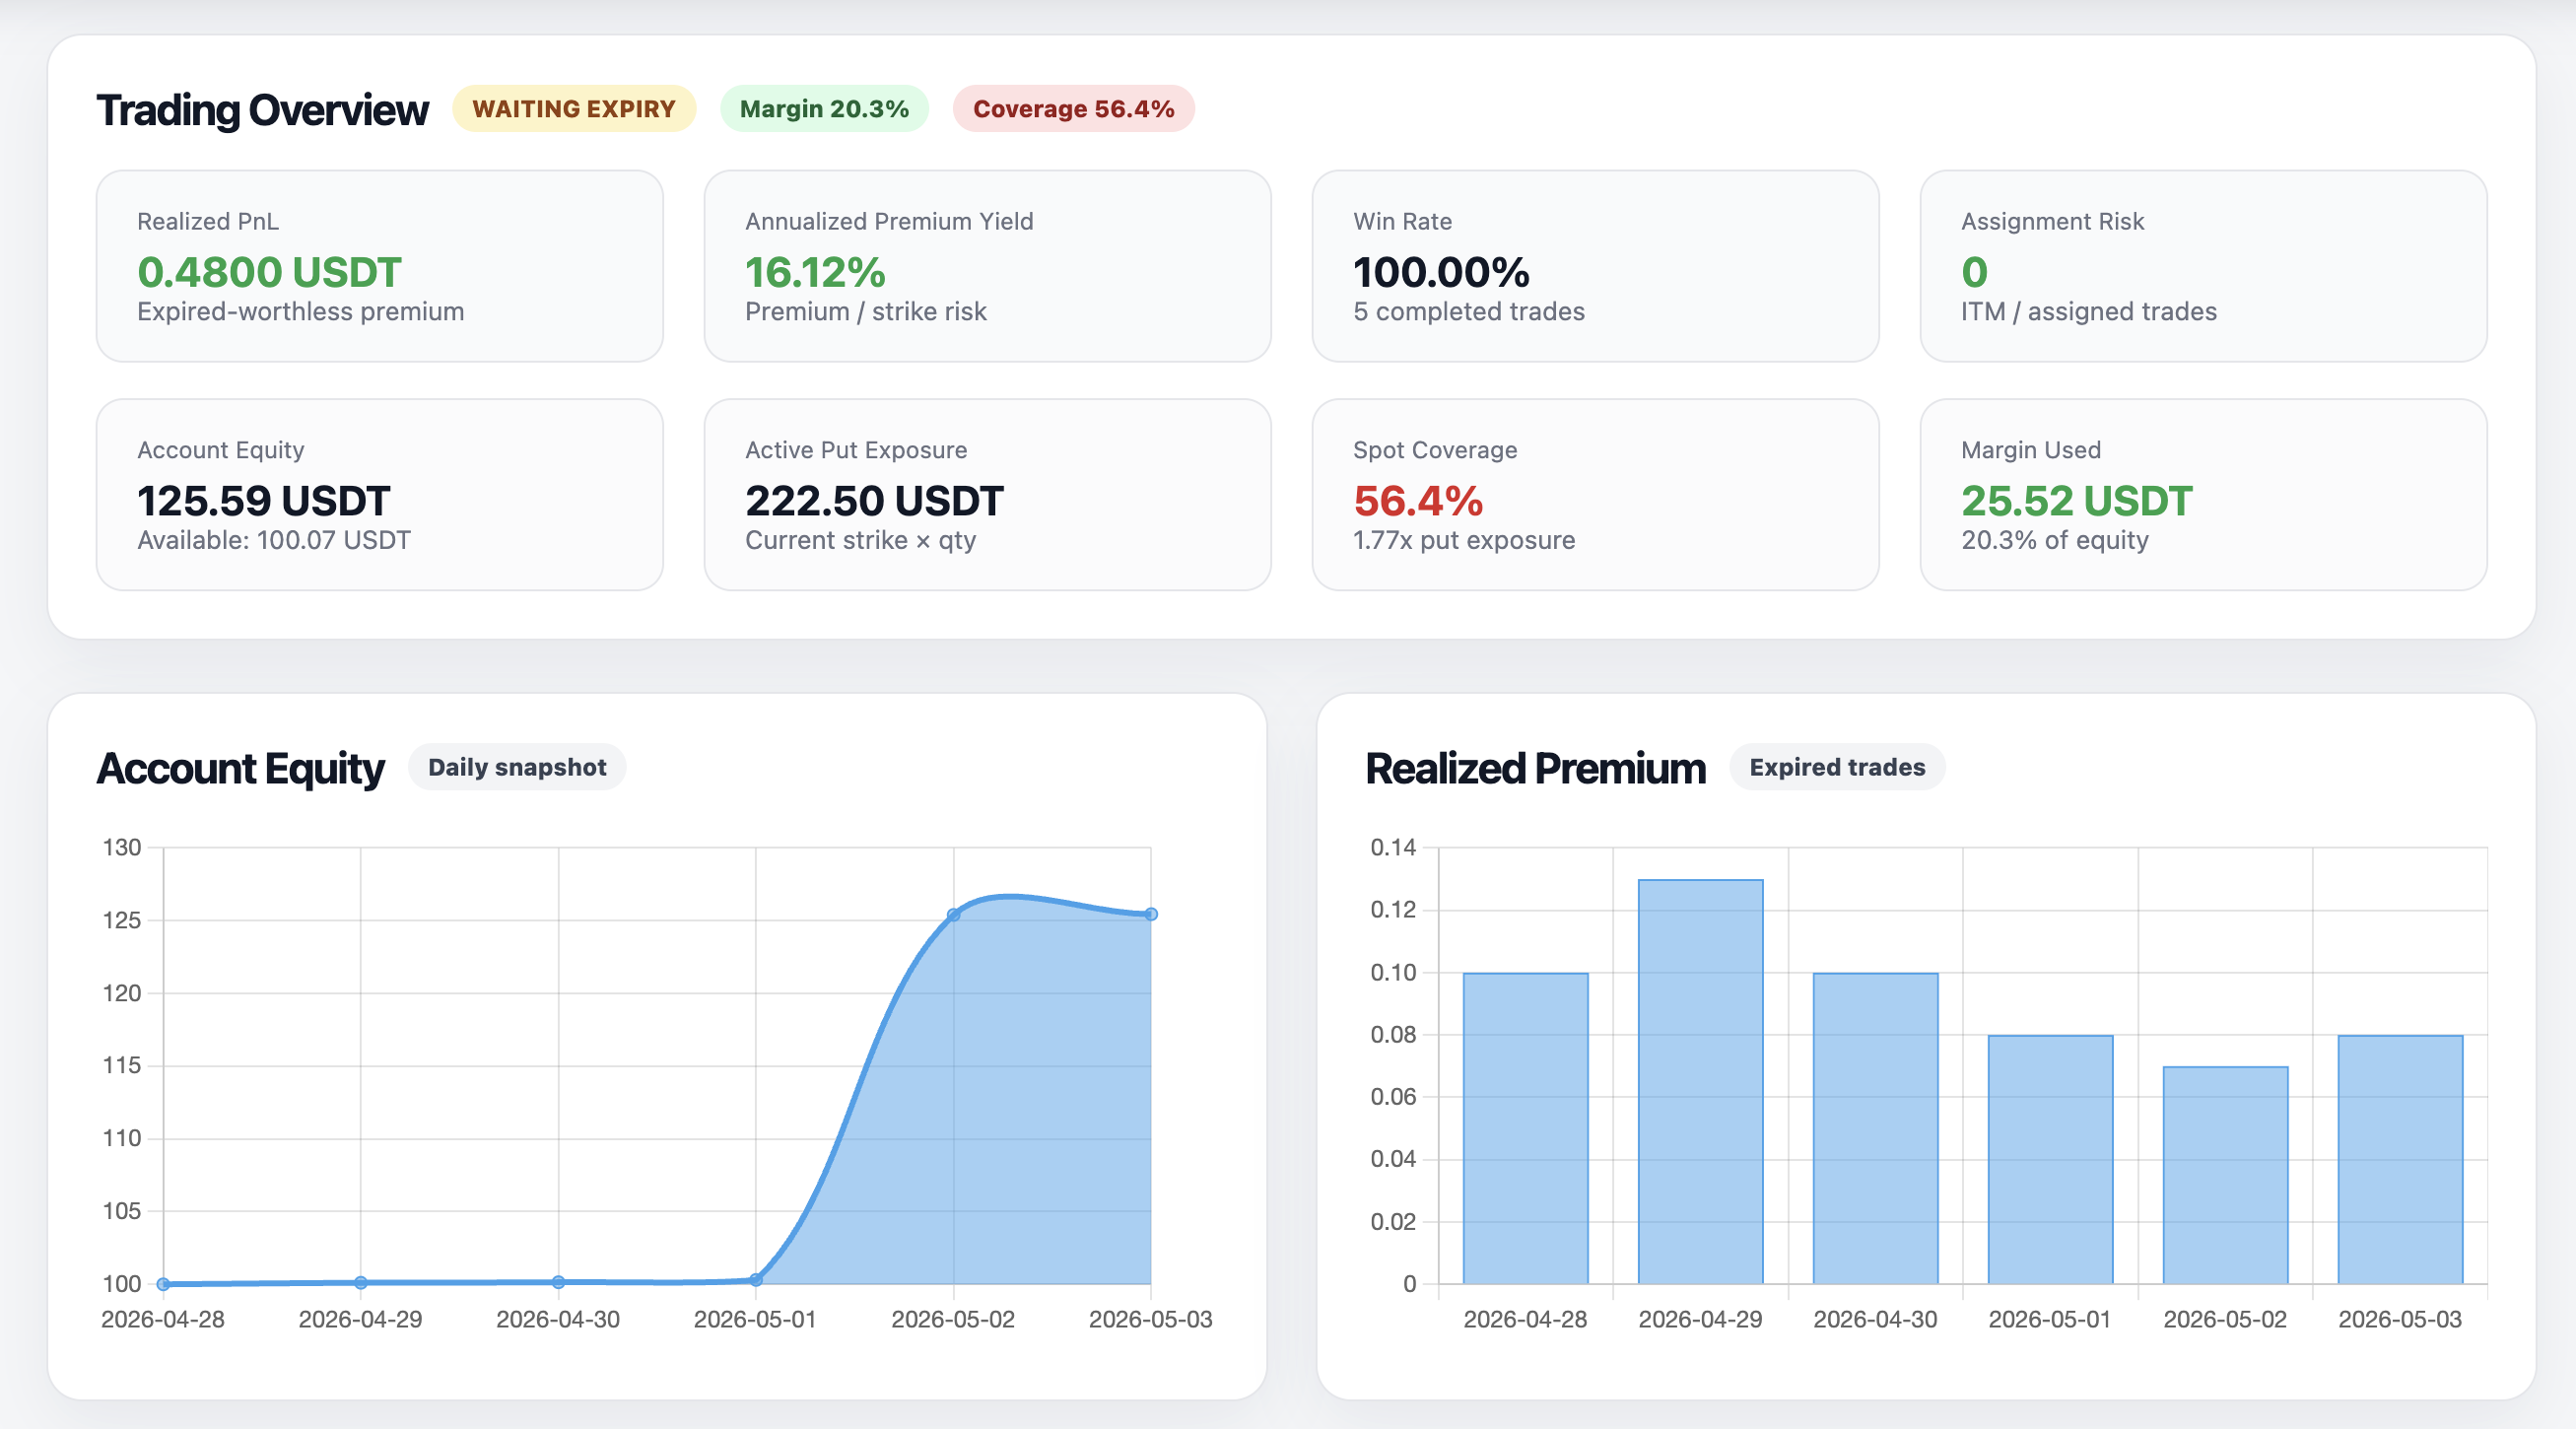
During this period, daily ETH price changes ranged between -1.57% and +1.72%, well within the thresholds targeted by the strategy. This range has been comfortably absorbed by the bot’s positioning.
A key variable to monitor is volatility at the time of trade entry. Notably, on days when ETH declined, the bot maintained strike placements more than 7% below spot. Given that the maximum observed downside move was -1.57%, this indicates a substantial buffer and suggests the strategy is functioning as intended under current conditions.
From a historical perspective, daily declines exceeding 7% occurred 11 times over the past 365 days. This provides a rough proxy for tail risk frequency and highlights that, while rare, such events are not negligible.
Assignment risk therefore cannot be fully excluded. However, systematically placing strikes at least 7% below spot materially reduces exposure, aligning the strategy with low-probability, high-margin positioning. Continued observation across a larger sample will be necessary to validate robustness under more extreme market conditions.
Assume the trading bot can tolerate up to a 7% daily drawdown. Over the past 365 days, there were 11 instances where ETH declined by more than 7% in a single day. Given the current strategy—systematically selling puts and going long upon assignment—we can expect approximately 11 assignment events per year under similar market conditions.
With a small initial position size of 0.1 contracts, the approach is to retain assigned spot exposure while continuing to sell 1 DTE puts of the same size. For example:
- Start by selling a 0.1 ETH put
- Upon assignment, acquire 0.1 ETH spot and continue selling a 0.1 put
- Total exposure becomes 0.2 ETH (0.1 spot + 0.1 short put)
- If assigned again, spot increases to 0.2 ETH, while another 0.1 put is sold
Repeating this process, cumulative exposure could scale to ~1.1 ETH over a year (0.1 × 11 assignments), assuming no position reductions.
Under these assumptions, the strategy targets roughly a 17% annual yield from continuous short-dated option selling. However, this estimate is highly path-dependent and sensitive to volatility clustering, trend persistence, and assignment frequency. Actual outcomes may diverge significantly, which is precisely why this analysis is being conducted.